
เปิดสถิติ ผู้ใช้อินเทอร์เน็ต และ Social Media ทั่วโลก
ในช่วงนี้ก็ได้เข้าสู่ช่วงปลายปีของปี 2018 แล้ว จึงถือได้ว่าเป็นช่วงที่เหมาะแก่การสรุปสถิติของ ผู้ใช้อินเทอร์เน็ต และ Social Media จากพฤติกรรมการใช้งานของคนทั่วโลก เพื่อดูทิศทางการเติบโตของอินเทอร์เน็ตว่ามีแนวโน้มไปในทิศทางใด สามารถเปิดช่องทางการลงทุนใหม่ๆ โดยอาศัยเครือข่ายอินเทอร์เน็ต และโซเชียลมีเดียได้หรือไม่
สถิติของ ผู้ใช้อินเทอร์เน็ต และ Social Media ทั่วโลกในปี 2018 นี้มาจากการสำรวจพฤติกรรมการใช้งานอินเทอร์เน็ต และ Social Media จาก 238 ประเทศทั่วโลก โดยการสรุปสถิติการใช้อินเทอร์เน็ต และ Social Media จากคนทั่วโลกนี้ สามารถสรุปออกมาเป็นประเด็นที่สำคัญๆ ดังนี้

ข้อมูลประชากรทั่วโลก และแนวโน้มการเพิ่มขึ้นของประชากรโลกในปีต่อๆ ไป
จากข้อมูลประชากรทั่วโลกในปี 2018 ได้สรุปไว้ว่าประชากรทั่วโลกในปัจจุบันมี 7,476 ล้านคน มีแนวโน้มการเพิ่มขึ้นของประชากรในปี 2030 อยู่ที่ 8,500 ล้านคน และเพิ่มมากขึ้นในปี 2100 อยู่ที่ 11,200 ล้านคน
ข้อมูลในการใช้งานอินเทอร์เน็ตของประชากรทั่วโลก
ปัจจุบันมีผู้ใช้งานอินเทอร์เน็ตทั่วโลก 3,773 ล้านคน คิดเป็น 50% ของประชากรทั่วโลก ถูกแบ่งออกเป็นผู้ใช้งาน Social Media 2,789 ล้านคน คิดเป็น 37% ของประชากรผู้ใช้งานอินเทอร์เน็ตทั่วโลก
นอกจากนี้ยังมีผู้ใช้งานสมาร์ทโฟน 4,917 ล้านคน คิดเป็น 66% ของประชากรทั่วโลก ที่ทำให้เกิดการใช้งาน Social Media ผ่านสมาร์ทโฟน 2,549 ล้านคน คิดเป็น 34% จากประชากรผู้ใช้งานอินเทอร์เน็ตทั่วโลก
ประชากรในภูมิภาคเอเชียแปซิฟิก และข้อมูลการใช้งานอินเทอร์เน็ต
ปัจจุบันประชากรในเอเชียแปซิฟิกมี 4,155 พันล้านคน ถูกแบ่งออกมาเป็นผู้ใช้งานอินเทอร์เน็ต 1,909 ล้านคน คิดเป็น 46% ของประชากรในภูมิภาคเอเชียแปซิฟิก ซึ่งเพิ่มขึ้นจากปีที่แล้ว 15% จึงทำให้ผู้ใช้ Social Media มีจำนวน 1,514 ล้านคน คิดเป็น 36% เพิ่มขึ้นจากปีที่แล้ว 25%
ในภูมิภาคเอเชียแปซิฟิกมีผู้ใช้สมาร์ทโฟน 3,999 ล้านคน คิดเป็น 96% ซึ่งเพิ่มขึ้นจากปีที่แล้ว 4% จึงทำให้ผู้ใช้งาน Social Media ผ่านสมาร์ทโฟนของในภูมิภาคเอเชียแปซิฟิกมีจำนวน 1,441 ล้านคน คิดเป็น 35% ของประชากรในภูมิภาค ถือได้ว่าเพิ่มขึ้นจากปีที่แล้วมากถึง 35%
สถิติการใช้งานอินเทอร์เน็ตในทวีปต่างๆ ทั่วโลก
– ทวีปอเมริกาเหนือ (North America) 88%
– อเมริกากลาง (Central America) 53%
– ทวีปอเมริกาใต้ (South America) 66%
– ยุโรปตะวันตก (Western Europe) 84%
– ทวีปแอฟริกา (Africa) 29%
– ยุโรปตะวันออก (Eastern Europe) 67%
– ตะวันออกกลาง (Middle East) 60 %
– เอเชียกลาง (Central Asia) 48%
– เอเชียใต้ (South Asia) 33%
– เอเชียตะวันออก (East Asia) 57%
– เอเชียตะวันออกเฉียงใต้ (Southeast Asia) 53%
– โอเชียเนีย (Oceania) 68%

อุปกรณ์ที่นิยมใช้ในการเข้าใช้งานอินเทอร์เน็ต
การเข้าใช้งานจากแล็บท็อป และเดสก์ท็อป 45% ลดลงจากปีที่ผ่านมา 20% ต่างจากการเข้าใช้งานอินเทอร์เน็ตผ่านสมาร์ทโฟนที่เพิ่มมากขึ้นจากปีที่ผ่านมาถึง 30% โดยปีนี้ก็อยู่ที่ 50% จากจำนวนของประชากรทั่วโลก นอกจากจากนี้ยังมีการเข้าใช้งานจาก แท็บเล็ต 5% ลดลงจากปีที่ผ่านมา 5% และการเข้าใช้งานอินเทอร์เน็ตจากอุปกรณ์อื่นๆ 0.12% เพิ่มขึ้นจากปีที่ผ่านมา 33%
การใช้งานอินเทอร์เน็ตในประเทศไทย
ปัจจุบันประเทศไทยมีจำนวนประชากร ทั้งประเทศอยู่ราวๆ 66 ล้านคน มีผู้ใช้งานอินเทอร์เน็ต 67% คิดจากประชากรทั้งหมดภายในประเทศ มีอัตราการเติบโตอยู่ที่ 21% ทำการเปรียบเทียบจากปีที่แล้วในช่วงเวลาเดียวกัน ประเทศไทยจึงได้ก้าวเข้ามาเป็นลำดับที่ 18 จากค่าเฉลี่ยการเข้าถึงอินเทอร์เน็ตของประชากรทั่วโลก อยู่ที่ 50% ส่วนลำดับที่ 1 นั้นคือ สหรัฐอาหรับเอมิเรตส์ที่ค่าเฉลี่ยการเข้าถึงอินเทอร์เน็ตของประชากรสูงถึง 99%
คนไทยส่วนใหญ่มักใช้เวลาในการเล่นอินเทอร์เน็ตผ่านเดสก์ท็อป หรือแล็บท็อป 4.35 ชั่วโมงต่อวัน ที่มากกว่าการใช้งานบนสมาร์ทโฟน ที่มีเวลาเฉลี่ยอยู่ที่ 4.14 ชั่วโมงต่อวัน จึงทำให้ประเทศไทยเป็นประเทศที่ใช้มาร์ทโฟนเข้าเว็บไซต์เป็นอันดับ 5 จากค่าเฉลี่ยของประชากรทั่วโลกที่ใช้สมาร์ทโฟนเข้าเว็บไซต์อยู่ที่ 50%
นอกจากนี้จากการสำรวจยังทำให้รู้ว่าคนไทยใช้ Social Media มากเป็นอันดับ 7 ของโลก ด้วยสัดส่วน 67% จากจำนวนประชากรทั้งหมดในประเทศ และเวลาในการใช้งาน Social Media เฉลี่ยวันละ 2.48 ชั่วโมง อยู่ในลำดับที่ 12 ของโลก
Some of the key takeaways from their Global Digital Report 2018 include:
- The number of internet users worldwide in 2018 is 4.021 billion, up 7 percent year-on-year
- The number of social media users worldwide in 2018 is 3.196 billion, up 13 percent year-on-year
- The number of mobile phone users in 2018 is 5.135 billion, up 4 percent year-on-year
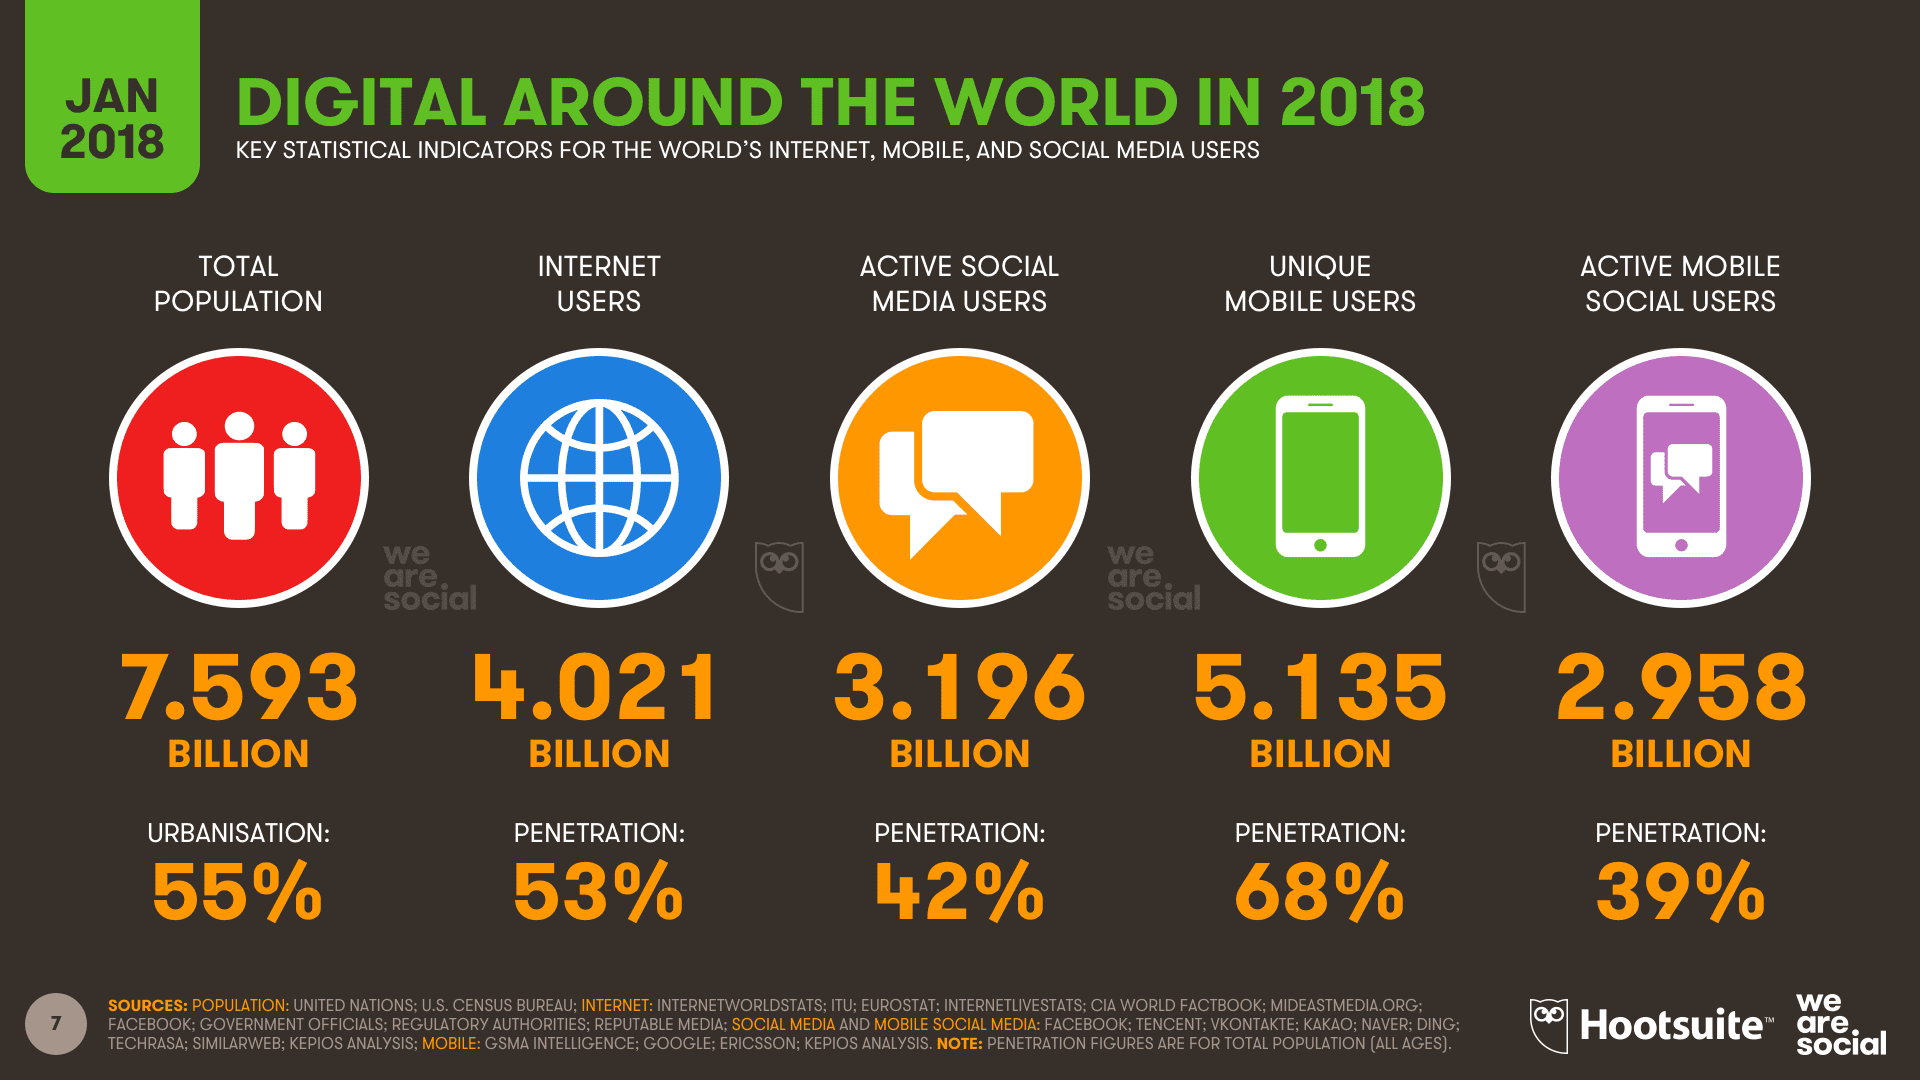
Annual growth continues apace, especially in active mobile social users - 39% penetration up 5% from 2017.
Share of web traffic by device highly favours mobile at 52% (+4% year-on-year change), whilst Desktop remains in second place with only 43% of device share to all web pages, down by 3% year-on-year.
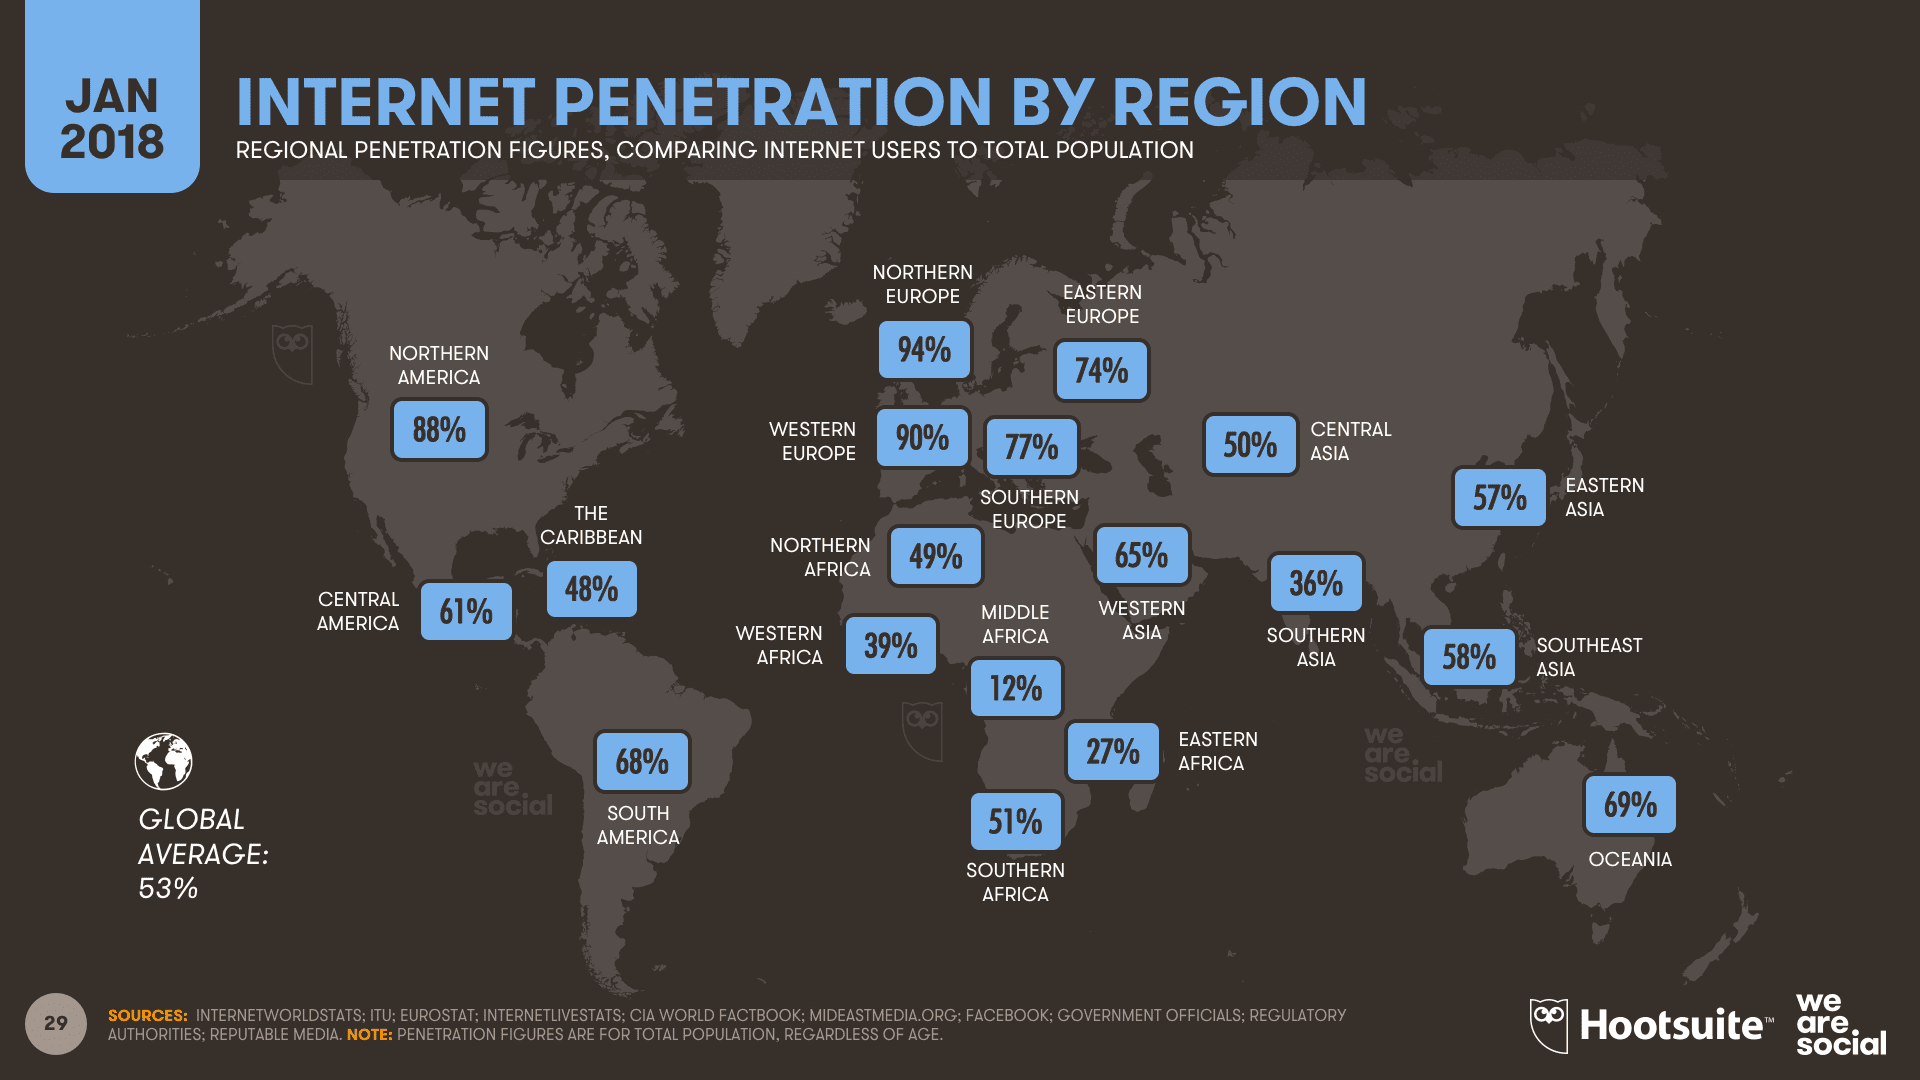
Northen, Western and South Europe and North America have the largest internet penetration with between 74%-94% internet users compared to total population.
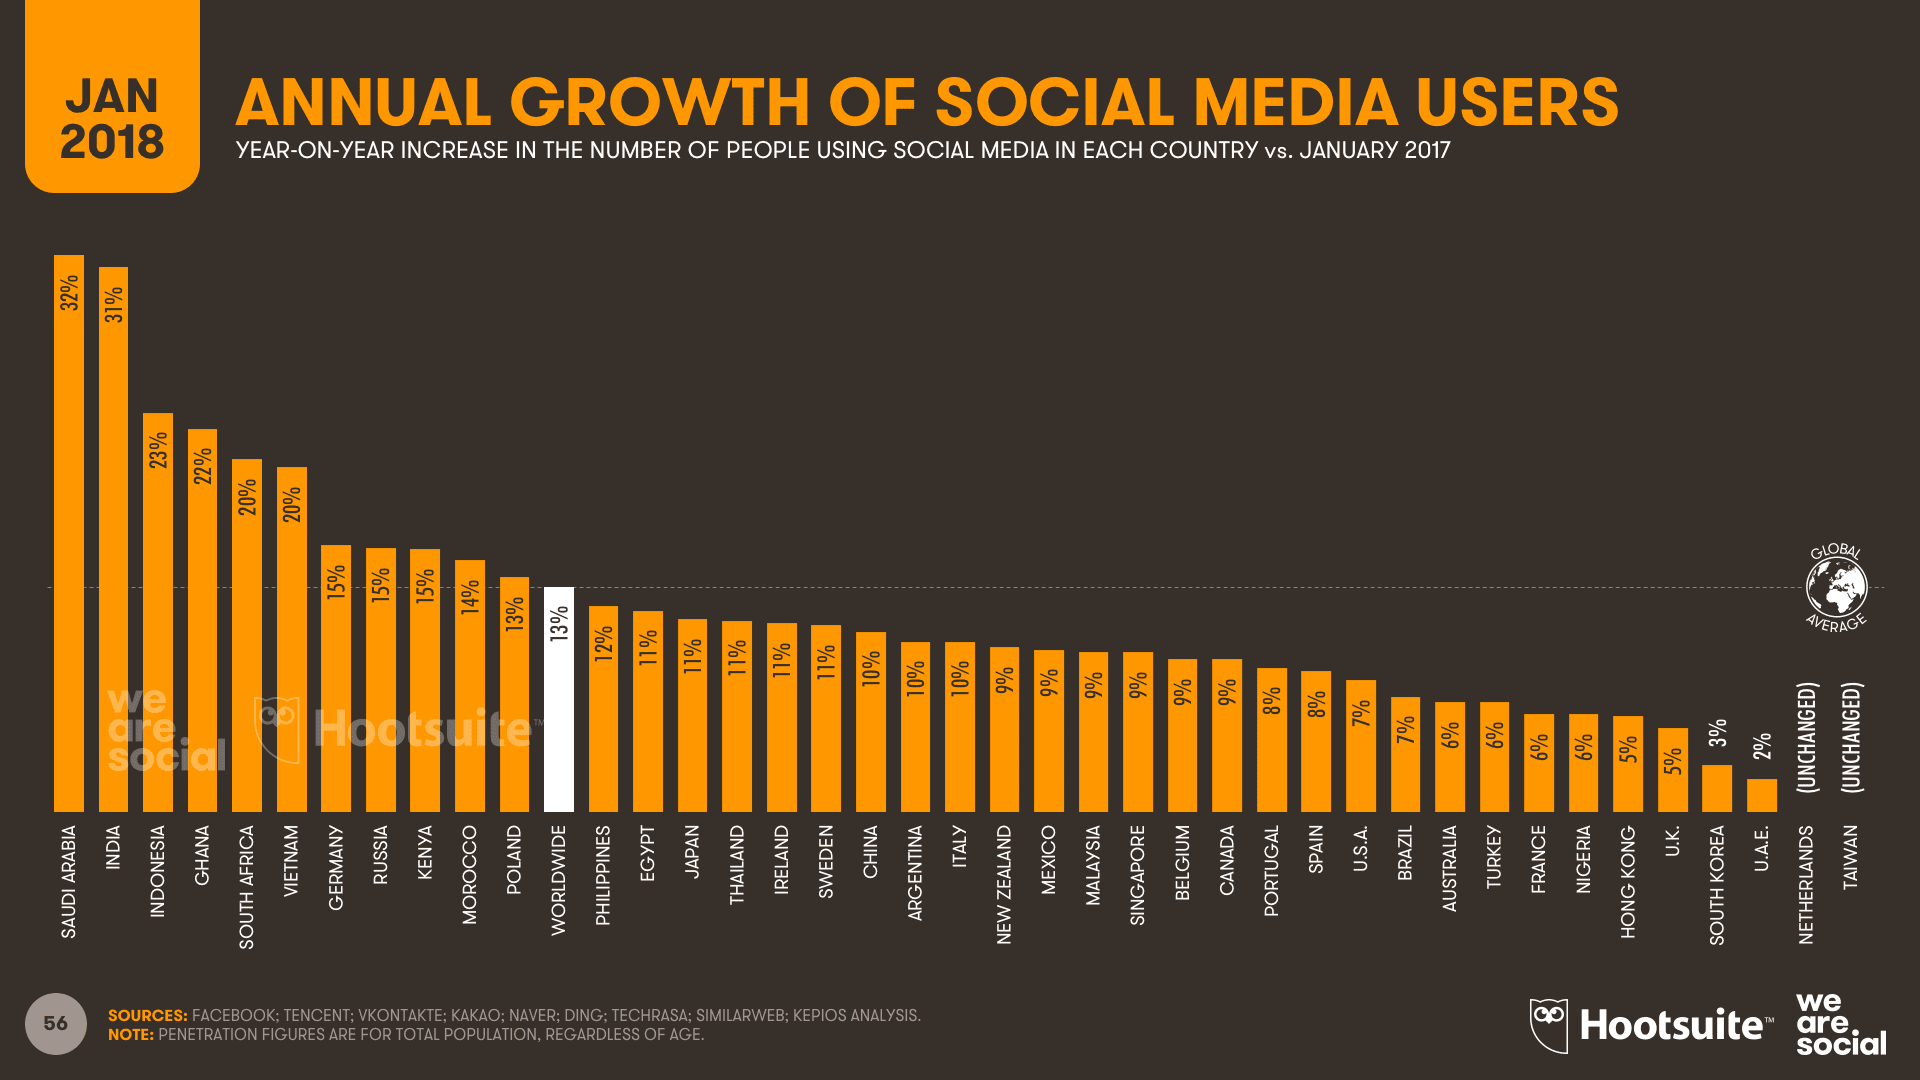
The global increase in social media usage since January 2017 is 13%. Saudi Arabia has the largest year-on-year increase in social media users since January 2017 (32%), a 17% increase compared to the global average. Other countries with the largest social media usage increase includes India, Indonesia and Ghana as technology is improving and social media becomes easily accessible to more of the population. U.A.E, South Korea and the UK have the slowest increase with <5%.

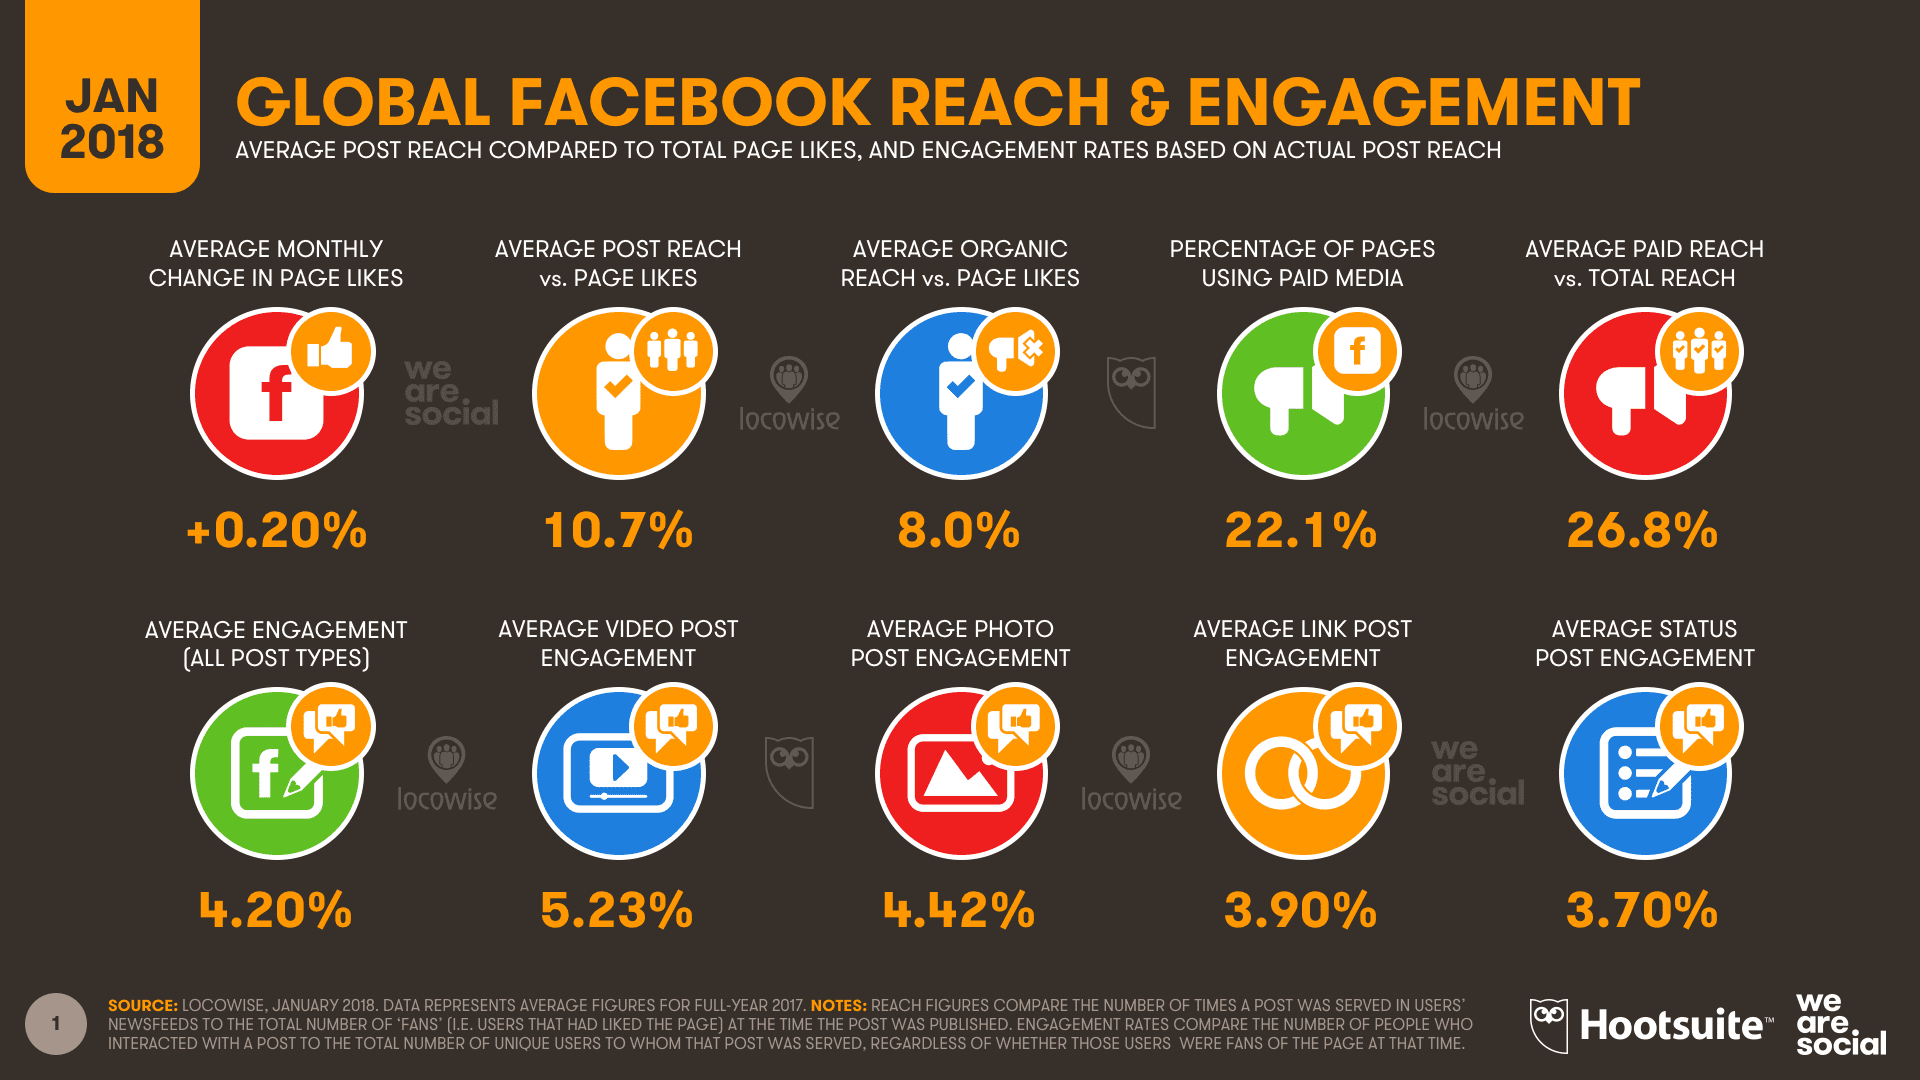
With Facebook having the most daily active users compared to other social networks it's important to know how your content may potentially perform and what features to use to optimize the reach of content. There is a 10.7% average post reach vs page like and 26.8% average paid post reach vs total reach. Facebook is a great social platform for organic and paid opportunities with a huge potential reach - just remember to target content to business personas to gain quality leads.
The full report from we are social contains a massive amount of data across 200+ slides. It provides country-specific data for the vast majority of the world, so you might want to check out the slides of the countries in your core markets to get a better idea of the current state of social in the areas you operate.
Q2. Which are the most popular social networks?
The latest insight from the comScore panel in their 2018 Global Digital Future in Focus compares the popularity of social networks by share of time (for December 2017) gives this data based on their home panel for the US, Canada, France, Germany, Italy, Spain, UK, Argentina, Brazil, Mexico, India, Indonesia, Malaysia. We have more detailed information on the UK and the US later in this article.
Most popular social networks based on share of minutes
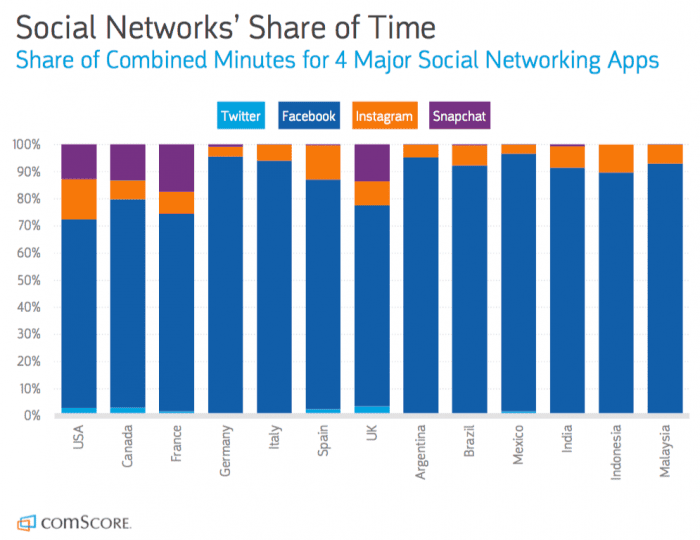
You can see this is a sea of Facebook blue, so this shows that despite the negative media hype about Facebook it is going to remain a major audience channel for some time.
In the UK you can see that Instagram accounts for around 10% of social media minutes, so if you are not already exploiting the latest Instagram ad techniques, then it's worth looking into these, see our digital media cheatsheet for more details.
This compilation of the most popular social networks worldwide by active users (October 2018) prepared by Statista using data from the Global Web Index panel gives a clear picture of the number of active users (in millions) with Facebook ruling supreme. This won't be a shock to anyone! With over 2 billion active users it holds the majority market share. Google's YouTube is second with Facebook-owned, WhatsApp and Messenger not far behind. Facebook's Instagram platform has fewer than half of the visits of Facebook...
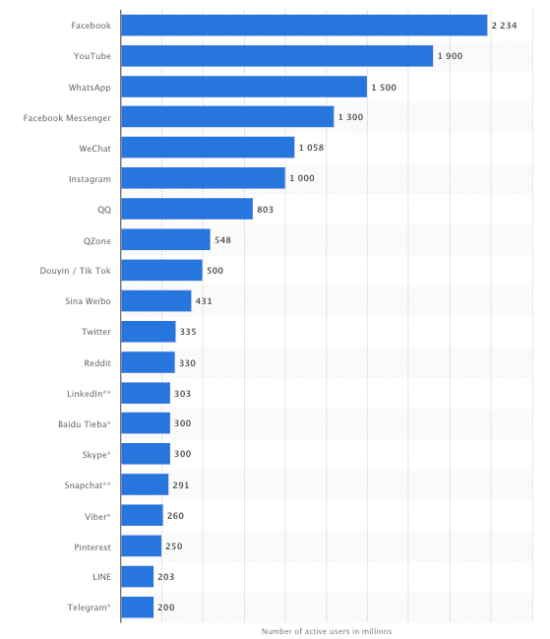
Following from this, we have predominantly APAC favoured platforms, with QQ, WeChat and Qzone all with over 600 million active users, highlighting the array of social platform offerings in the APAC. We then see a cluster of predominantly western social media networks in Tumblr, Instagram, and Twitter.
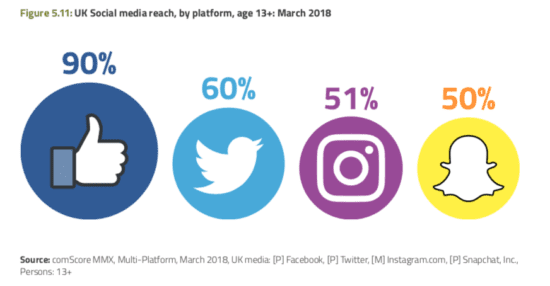
United Kingdom Social network popularity
The latest OfCom Communications Market report gives this summary for the most popular UK social networks as of March 2018.
Q3. Which are the fast-growing social networks?
Every marketer has limited time for social media marketing, so which fastest growing social network should you focus your efforts on?
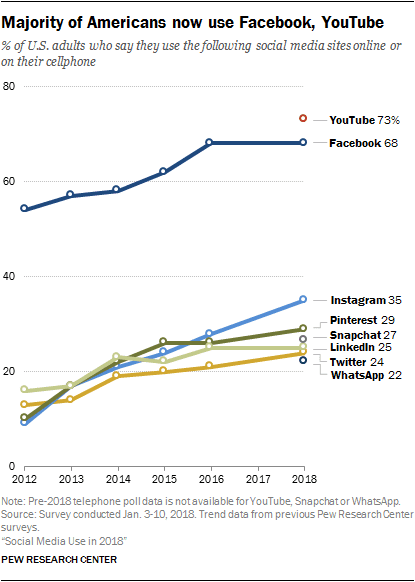
United States Social network popularity
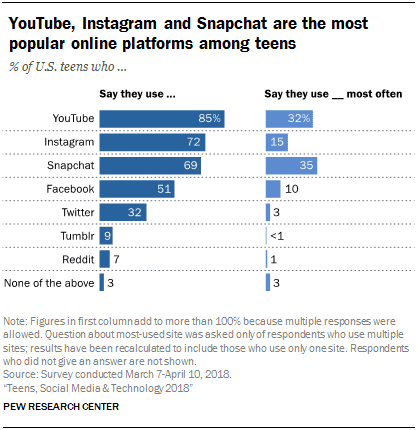
This Pew Research Internet Survey data on gives more detailed insights on US social media usage and growth rates.
It also reports social media teen use in US from a report Teens, Social Media and Technology 2018.
This comScore panel data from the Communications market report shows growth ratest based on demographics in the UK for Facebook and Instagram:
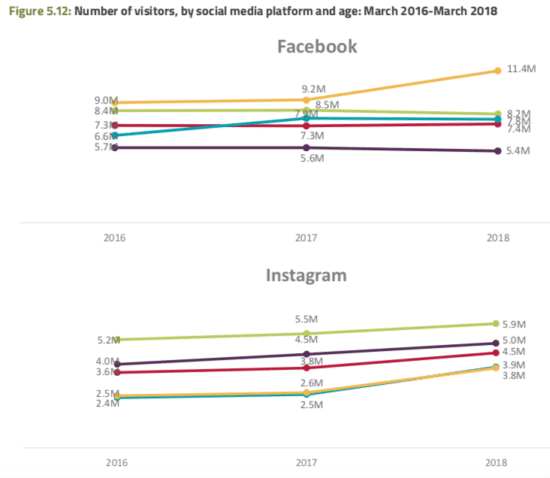
The report also shares data on Snapchat growth:
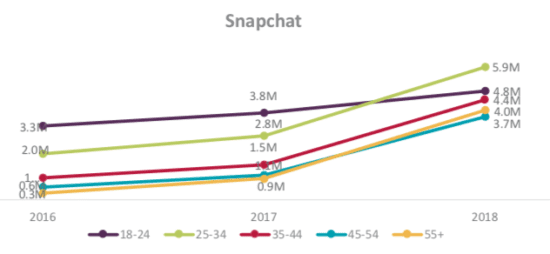 This comparison of changes in monthly active users shows that although Facebook is declining in some demographics such as 18-24 and 25-34, it and Instagram are still growing rapidly overall. Snapchat has also had significant growth.
Q4. How do social users interact with brands on social?
Knowing how to behaviour / post on social media is also important as this is reflective of your brand personality and consequently influencers social uses to buy or unfollow! Social media is increasingly being used as a customer service platform where customers and potential customers want answers quickly and in real-time. Only 27%of social media user respondents will be prompted to purchase products after seeing behind the scenes content shared on brand social pages.
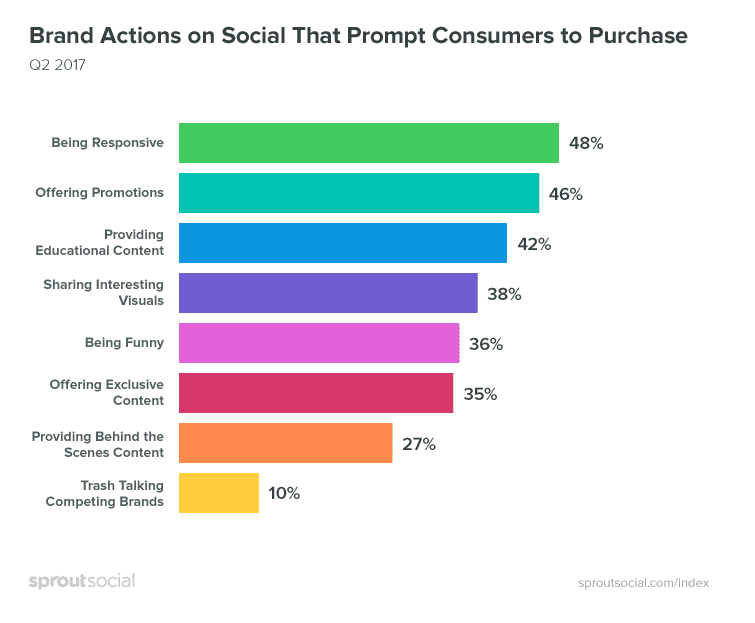
51% said that they would unfollow brands on social media if they posted irritating posts and 27% said they would mark/report the brand and page as spam and block them. This is why posting relevant, interesting content that resonates with your target audience and social users is important in retaining your Reach and Engagement with potential customers.
Q5. Which is the most engaging social network?
Another factor which determines the time we put into social media marketing is the engagement of the audience. Here we again see the dominance of Facebook - it's also got the greatest engagement in time according to this insight from the US consumer panel from comScore.
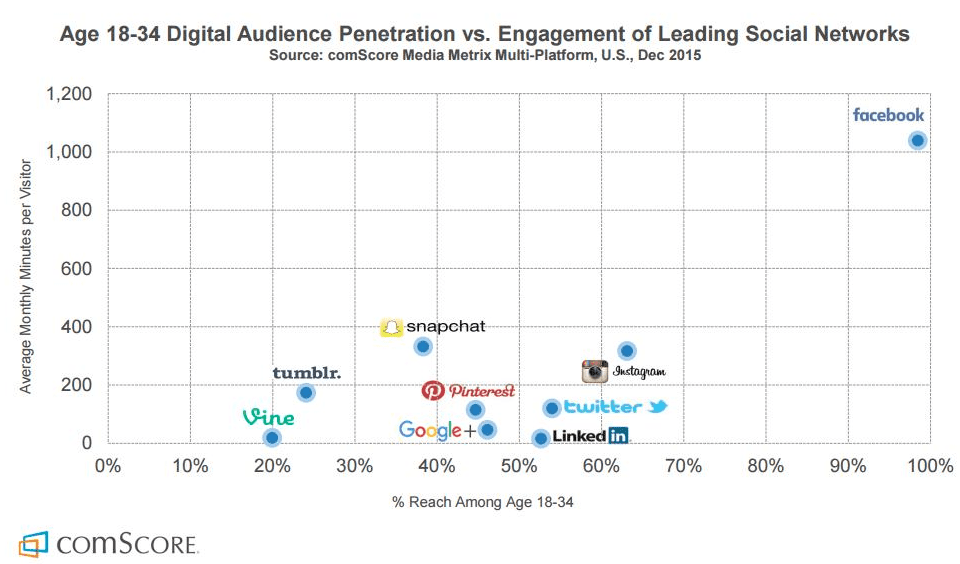
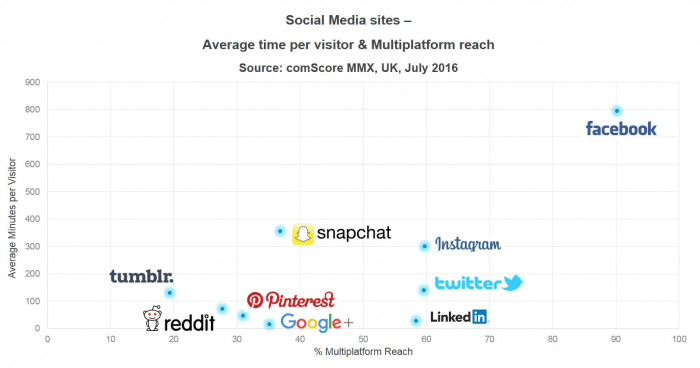
comScore has also published a more recent update on engagement in the UK comparing Facebook vs Twitter vs Instagram vs Pinterest vs Snapchat.
The above chart from Comscore shows engagement in terms of time spent on the platform vs reach among the millennial demographic. It's interesting to see how effectively Facebook dominates, but also interesting to see how well Snapchat and Instagram are doing in terms monthly usage per visitor. For more Snapchat stats, see our post on Snapchat Marketing Statistics.
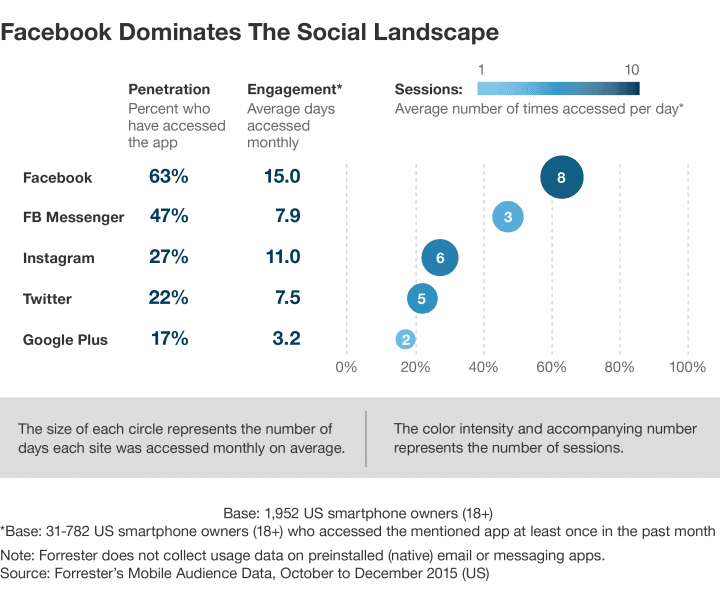
Facebook's dominance is truly extraordinary. Not only does it take the top spot, it's other platforms also take 2nd and 3rd respectively. Facebook Messenger has an impressive 47 penetration, and Instagram (also owned by Facebook) comes 2nd for engagement.
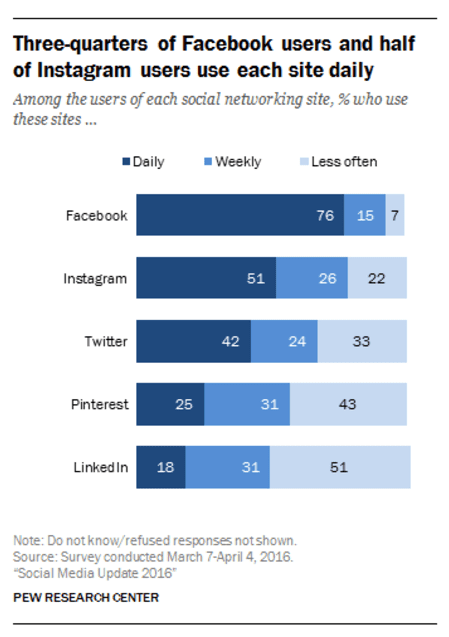
In this recent chart from Pew Internet below, we can see in terms of active daily use Facebook is also in the lead. 76% of users log in daily, whilst 51% do for Instagram (owned by Facebook). Twitter manages just 42% of users login in daily, only just over half the Facebook figure.
Q6. What are the different interaction rates in social media?
TrackMaven analysed 51 million posts from 40,000 different companies over 130 industries to establish which social networks achieve the greatest engagement per follower. The results show that Instagram absolutely dominates when it comes to interactions per 1,000 followers. In fact, it is so much higher than the other channels we've had to include a second chart just to show the difference between Facebook, LinkedIn and Twitter!
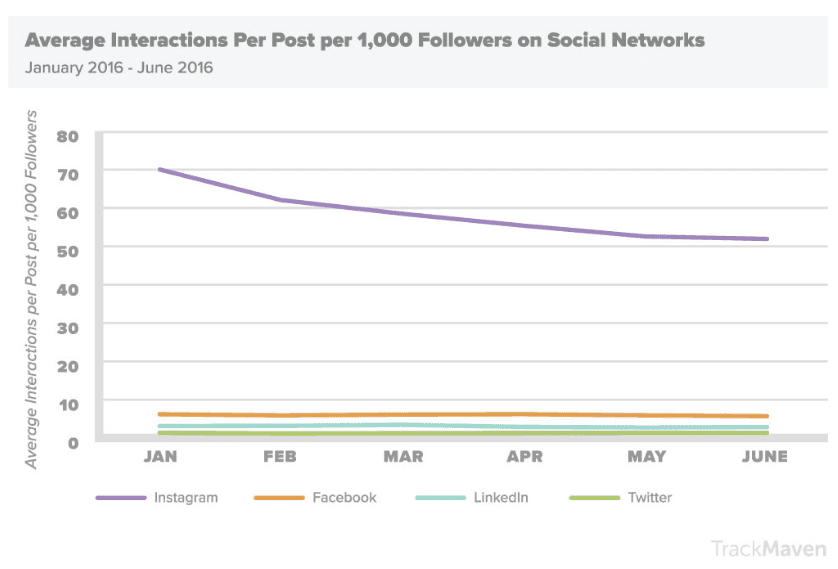
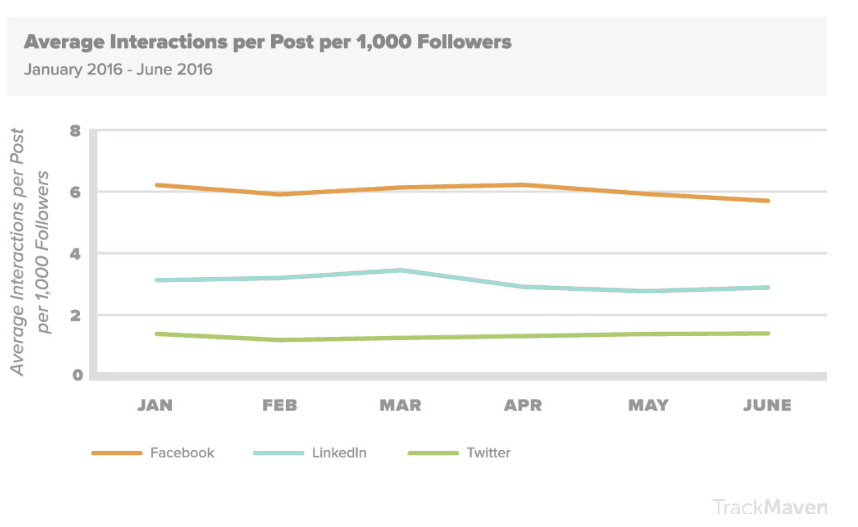
As you can see, Instagram dominates, but when it comes to the other networks Facebook has a considerable lead on Twitter and LinkedIn. This is in large part because people tend to post a lot more on Twitter because it doesn't have an algorithm that only serves posts to a small section of an audience. This has turned Twitter into a bit of fire hose of content where companies have to share more and more often to be heard through the noise. This has resulted in lower engagement per post.
US Social media adoption
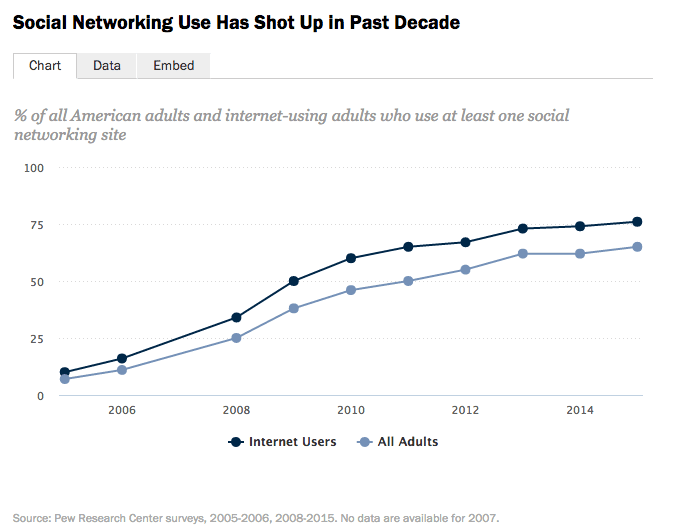
US consumer technology adoption specialists Pew Research Center released a new set of data on US Social Media US on October 8th which shows the latest social media trends and how far it has permeated society. Looking at data from the past 10 years, it charts the meteoric rise of social media.
10 years ago on 7% of the US population used one or more social networking sites. Now that figure has increased almost tenfold, to 65%. Of those who use the internet a massive majority of 76% of American's use social media.
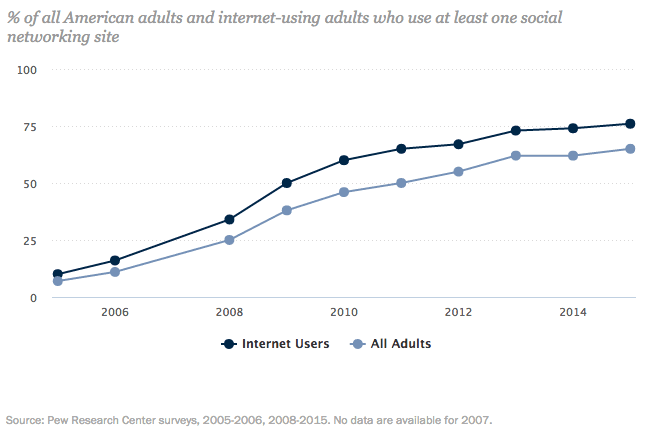
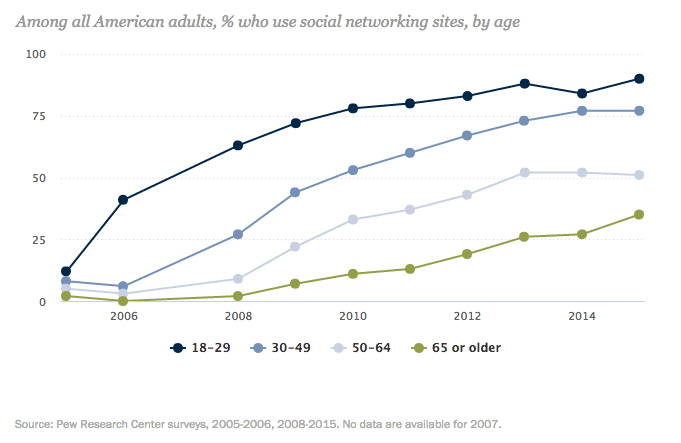
Social Media has grown massively, but it's growth is now starting to plateau. Interestingly the over 65s segment are now driving growth, as other age groups have plateaued completely and use is hardly growing it all. Among the 50-64 age cohort, use hasn't increased since 2013.
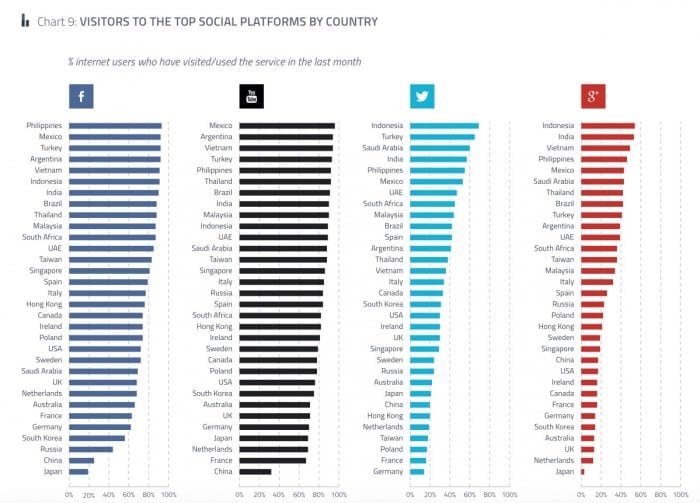
Social network popularity by country
This is a great visualisation of the popularity of social networks based on the interviews in the GWI report. If you pick out your country it's probably way behind the countries in which these four core social networks are most popular. Indonesia, Philippines, Mexico, India and Brazil are in the top 10 for each with significantly higher levels of use than the US, UK and European countries.
Use of social networks by different demographics
This chart is striking for the similarity of usage across different age groups. It shows that the social networks are now at a stage of maturity where they give opportunities to reach all age and gender groups. The exceptions to this are Instagram and Tumblr which are clearly popular with younger age groups.
Cr :: https://www.statista.com/statistics/617136/digital-population-worldwide/https://www.smartinsights.com/social-media-marketing/social-media-strategy/new-global-social-media-research/
https://www.am2bmarketing.co.th/online-marketing-article/2017-internet-and-social-media-statistics-worldwide/